Data Connectors And Data Sources In Data Studio
When we talk about Google’s Data Studio, data connectors, data sources and data sets, that’s a whole lot of ‘data’ to be throwing around and it can cause some confusion. Since these are the fundamental and only ways to get information into your reports, short of copy-and-pasting (please don’t do this), it’s worth having a solid understanding of what they are and how to use them.
Data, Data, Data
Data Studio is one of the newer products from Google that allows you to create reports and visualizations. It is outside of Google Analytics but works well with your Google Analytics or Analytics 360 data. If you’re using either, you should start experimenting and using Data Studio now! Even if you are using other BI solutions, there really isn’t a downside since it’s free and has a gentle learning curve compared to some other products out there. See our post here for more information.
A Blank Page
If you’ve decided to try out Data Studio, logged in and created a new report, you might be staring at a blank page with no direction where to start. Sure, you can start with text, shapes, colors and decorative elements, but I recommend a data-first approach to reporting. This is where Data Connectors and Data Sources come into play. In order to make any kind of report, you must first get and direct the information to where you want it to go.
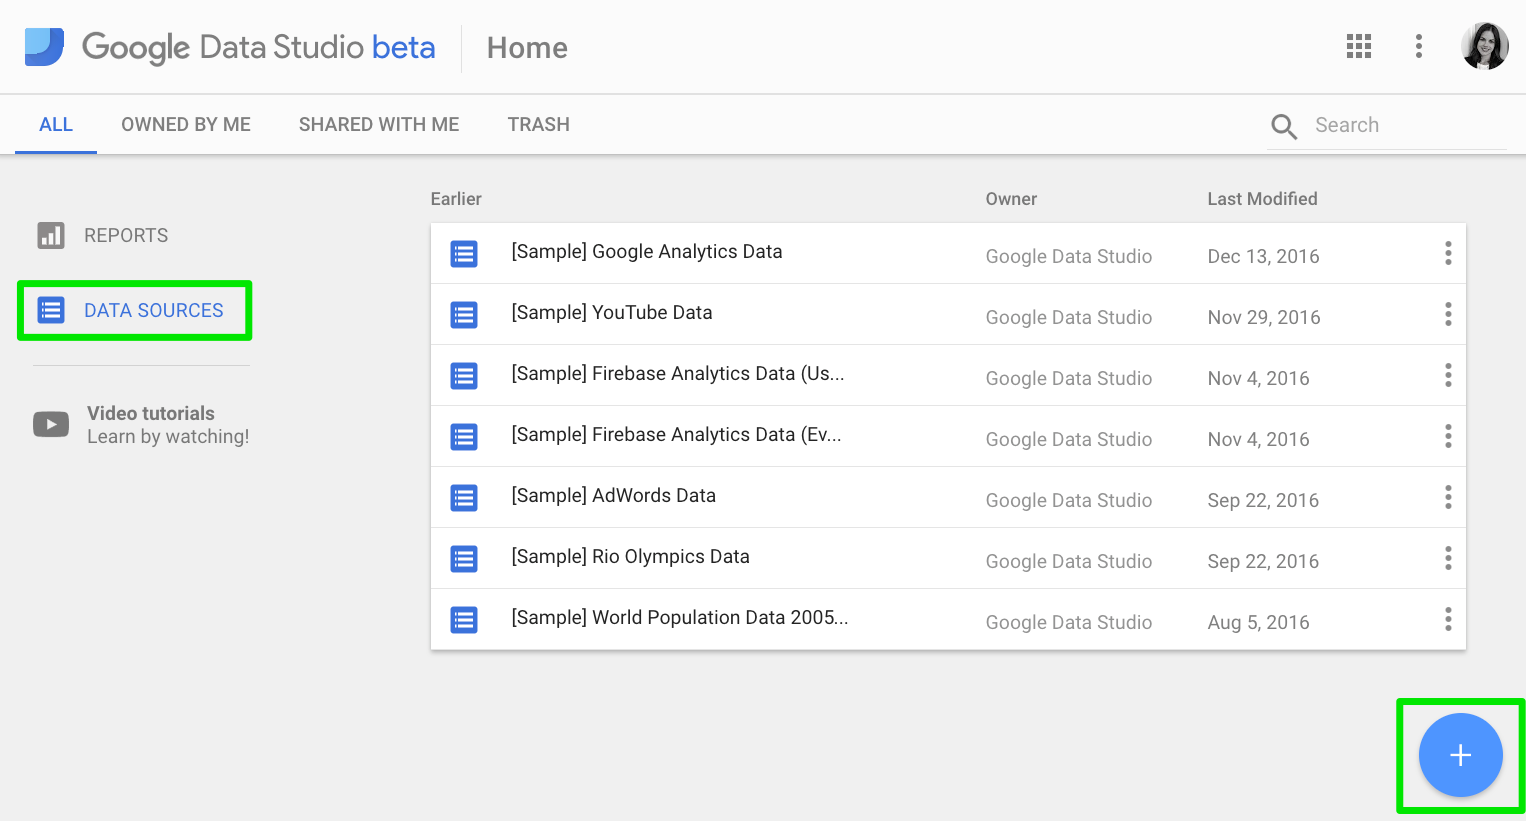
**One way to start the data connection process is to go to your Data Studio homepage, choose ‘Data Sources’ on the right-hand side and click the big blue circle on the bottom left.
Bringing the Data In
Data connectors and data sources are always used together. Let’s think of it in terms of a TV screen instead of a computer screen for a moment. I want and need to watch Westworld but I have to figure out a way to get that onto my TV. Westworld is the data and the data source here could be a Roku, Apple TV or cable box. This still doesn’t let me see Anthony Hopkins in the wild west because I need something to connect these devices to my screen. This is where the types of cable, or data connectors, in this metaphor fit in.
Without a connector, the data source can’t reach its destination and without a data source, there’s nothing to bring the data set into your reports. While you may not have access to data sources, you will always have access to every type of data connector available for the potential to connect to these types of data.
The full list of connectors that are currently available (as of today, and growing!) in Data Studio are below:
- Google Ads/li>
- Attribution 360
- BigQuery
- Cloud SQL
- DCM
- Google Analytics
- Google Sheets
- MySQL
- PostgreSQL
- Search Console
- YouTube Analytics
- Bing Ads
- Amazon Shopping
- Facebook Ads
- eBay Seller Center
- LinkedIn Ads
- MailChimp Analytics
- PayPal
- Salesforce Community Connector
- Vimeo
- Yahoo Gemini
- ShufflePoint Preview
When bringing in information to your Data Studio reports, the first step is to think about where the data is coming from and to look at this list to see if it matches any of these data connectors. The reason I want to point out ‘currently available’ is because Data Studio is still in beta and changes, additions and expansion should be expected in the future. Also, you cannot add or create your own data connectors.
Where’s Firebase?
If you are using Firebase Analytics, the Firebase data must first be connected to BigQuery. Information on how to link two is here. BigQuery is a paid product by Google, but is virtually free if you are a 360 customer.
I’m a Publisher. Where are the DFP (DoubleClick for Publishers) and AdExchange Connectors?
Good news! If you have Google Analytics 360, you can link DFP to Google Analytics. So if your DFP data is already in Google Analytics, it will automatically be available with the Google Analytics connector.
What If None of the Data Connectors Match My Data?
Update June 2018: Community Connectors have helped fill the gap of data that was previously unavailable in Data Studio! Read more:
Published: June 20, 2018
The list of connectors may look short, but it is pretty extensive under the hood. The ability to connect to SQL databases and BigQuery give the opportunity to bring in nearly any data. This would just require the extra step of taking whatever format and location your data are in and porting it over to a SQL or BigQuery format. So instead of a direct road, this one involves an extra turn. This would be the method to use if you do not have Google Analytics 360 for Firebase and DFP data in the steps above as well. Don’t forget – the Google Sheets connector is also available!
Data Sources
Now onto the most important part – the actual data. Once you know where your data is coming from and choose the appropriate connector, the next step is retrieving the data set from the Data Source. For the purpose of this post, we will use a Google Analytics Data Source.
Side Note: You may be familiar with using Google Analytics data outside of the interface if you’ve used Analytics APIs or even the Google Sheets Add-on (which also uses the API). One great thing about using the data in Data Studio is that the connector does not use the API, so it does not share the same limitations. Sampling should match the interface and since it is a direct connection, no queries or coding are required.
The data set here would be the View. It makes sense because the View has all of the reports and metrics for your website.
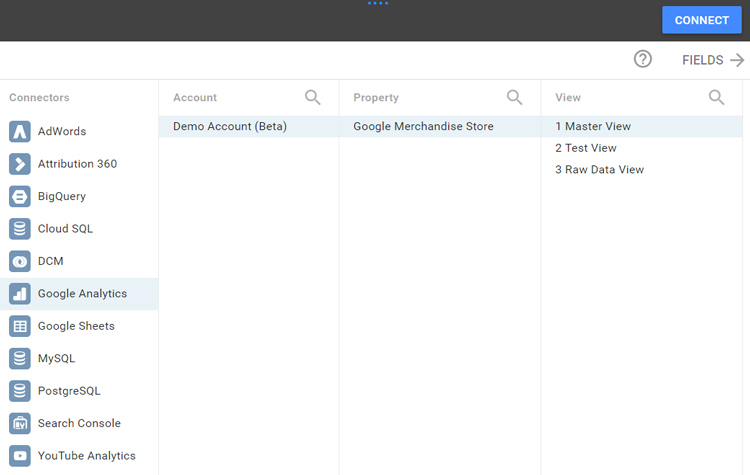
So all together, we have the View (data set), Google Analytics Data Source (where the data is) and the Google Analytics Data Connector. It’s the easiest data to get started with Data Studio since you only need basic permissions to a View to use it in your reports. In other words, if you see it in Google Analytics, you can use it in Data Studio.
While there are several parts and many terms/designations that sound nearly identical, don’t feel intimidated by the tools you need to start reporting on your data!
