Use a Demographic Segmentation Approach to Gain Better Customer Insights

Customer insights are an essential part of any marketing strategy. Do you know who your target audience(s) are? Where do your customers live? What is their income? What kind of homes do they live in (both age and value) and do they have children? What is their education level? What are they purchasing and how do demographics differ across different product lines? Answering these types of questions is possible through demographic customer segmentation.
Knowing who your customers are is so important! If you know who your customers are (age, income, family status), you know where to find them. If you know where to find them, you can develop a more targeted, data-driven approach to marketing to these audiences. Many different media platforms have the ability to target audiences at a campaign level. Demographic audience segmentation can help us prospect new audiences, whereas a behavior based audience segmentation’s advantages tend to lean towards existing customers (shopping habits / purchase patterns), and is more desirable for retargeting.
There are many ways to perform a demographic audience segmentation. A common approach is to have your customers answer survey response questions, perhaps by incentivizing them through a customer loyalty program, where they may fill out a survey about their age, gender, income and a few other areas of interest and in return receive a discount on their next purchase. Another option is to match existing customer address information to publicly available census data.
The advantage of this approach is that you need only the customer’s address. It can be difficult to get existing customers to hand over information about their personal lives, and, oftentimes companies already have a lot of information on hand via billing or shipping addresses. The data is literally waiting to be analyzed. A customer’s postal address can easily be traced back to varying geographic levels ranging from DMA/CBSA all the way down to census block group. A census block group is as close as we can get to neighborhood level insights. For example, as of 2019 the United States could be divided into 217,740 block groups and 41,692 zip codes, meaning there are roughly 5x more block groups than zip codes.
The American Community Survey (ACS) releases data on each of these block groups each year. From the ACS, we are able to get a variety of different estimated values, ranging from age to income to educational attainment and familial status. By analyzing the composition and makeup of the neighborhoods our customers live in, we are able to estimate the composition and makeup of our customer bases.
A Real Life Example
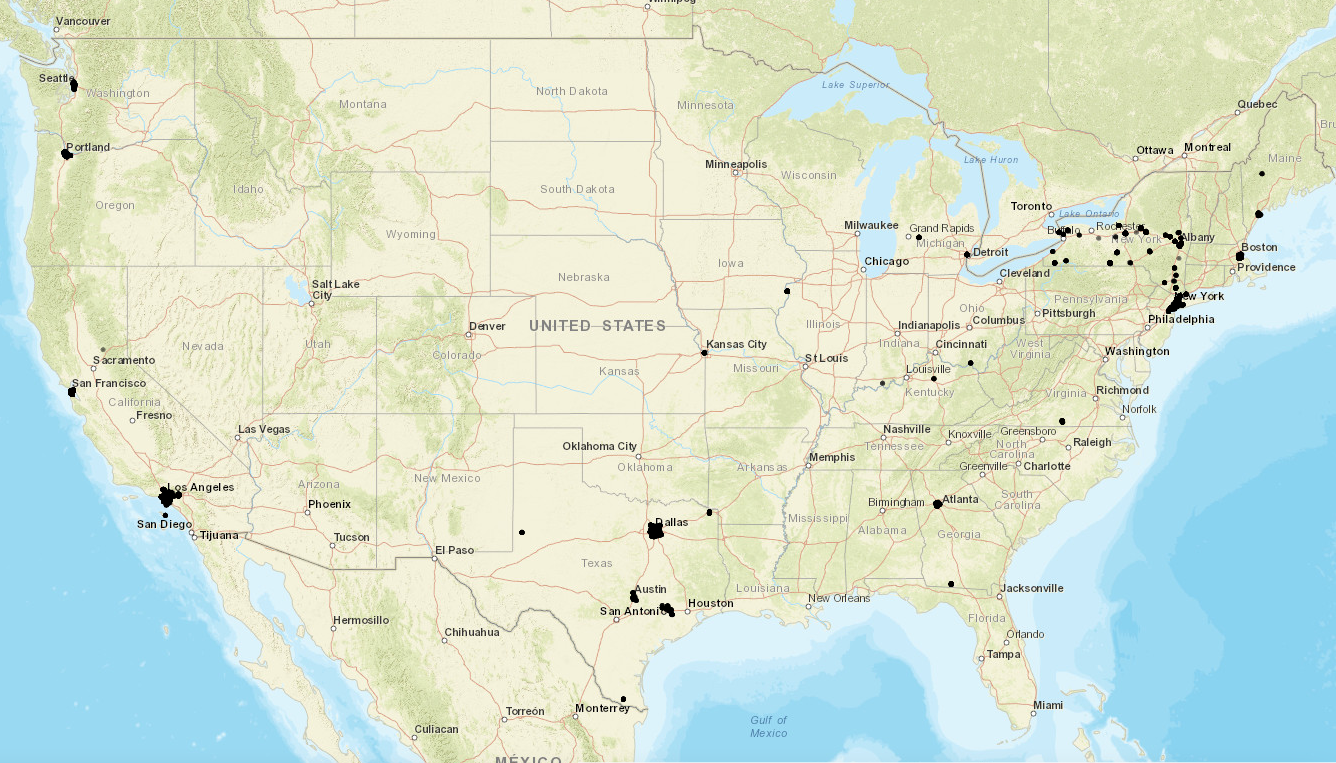
To illustrate this approach, we will take Kaggle’s Sales Product Dataset, and geocode a sample of 15,000 unique purchase addresses to latitude and longitude. As you can see in the visual below, these customers mostly reside in metropolitan areas across the US.
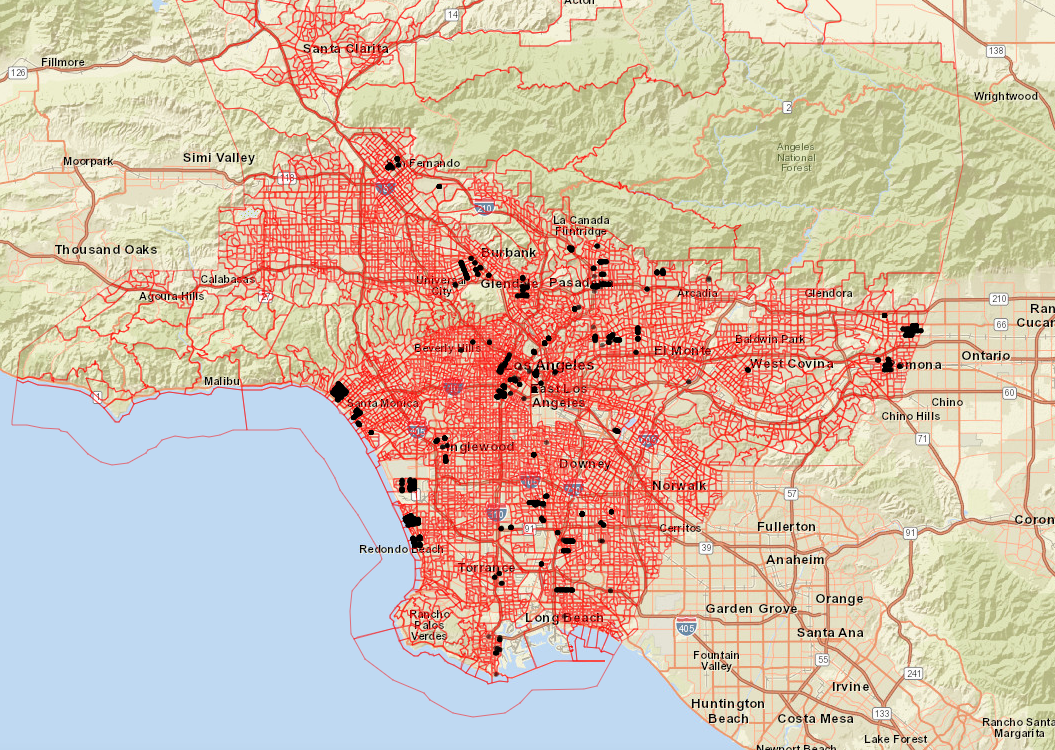
With the customer latitude and longitudes on hand, we are able to identify the census defined block groups these customer’s reside in. In the example below, you can see customers in Los Angeles, California’s latitude and longitude, overlaid with the census block groups they reside in.
Using the ACS API, below are a few of the many different demographic estimates we are able to obtain about the block groups our customers live in. Some of these are provided below:
- Median HH Income
- HHs with presence of under 18
- Median HH Value
- Population by Age
- HH Income by Buckets
- HH Value
- Owner Occupied HHs by year built
There are many different ways to slice and dice a demographic dataset. One seemingly obvious solution was to compare breakouts of electronic equipment types by our indicators. In our demo dataset, there are two different types of phones (Google Phone & iPhone), two different types of laptops (ThinkPad Laptop and MacBook Pro Laptops), and three different types of headphones (Bose SoundSport Headphones, Wired Headphones and Apple Airpods Headphones). An equally obvious question seems to be, are there statistically significant differences in any of the above mentioned demographic features for our breakouts of electronic devices?
To answer this question, we can use one way Analysis of Variance (ANOVA) to test whether there are statistically significant differences in the mean values of the populations for our different breakouts. And, if so, what are the insights we can glean from these comparisons? As a quick refresher from your college stats class, an ANOVA test will result in an F value and a p value. The F value is defined as:
F =MST/MSE
Where, F, is your ANOVA coefficient, MST is the mean sum of squares due to treatment and MSE is the mean sum of squares due to error. In layman’s terms, this formula can be re-written as:
F =Mean Squares Treatment/Mean Squares Error
This is how we determine the variability between samples. If there is no statistically significant difference between our two samples (also called the Null Hypothesis), our F score will converge at 1. The larger the F value, the more variation exists between samples. Depending on the F value, and the number of degrees of freedom, a corresponding p value exists, which ultimately tells us whether our samples are statistically significant. A p value, less than .05, indicates that the difference in the populations are statistically significant.
Using this approach, we are able to identify one statistically significant insight with respect to Phone, and several more with respect to Laptops. Some of these results are shown below. Keep in mind the results are from a sample dataset. Our intent is to present a technique to demonstrate how you can mine customer addresses for demographic insights, not to extract a literal interpretation of the results of this specific sample dataset.
| Indicator | F | p | Breakout | Subset with Highest Mean |
| Population 65+ | 3.96 | .0467 | Phone | iPhone |
| Median HH Income | 17.9 | 2.465e-5 | Laptop | ThinkPad Laptop |
| HH Income 200k+ | 9.11 | .00259 | Laptop | ThinkPad Laptop |
| Population 18-24 | 8.32 | .0039 | Laptop | ThinkPad Laptop |
| Population 35 - 49 | 9.86 | .0017 | Laptop | ThinkPad Laptop |
| Population 50 - 64 | 7.03 | .008 | Laptop | MacBook Pro |
| Population 65+ | 9.03 | .0027 | Laptop | MacBook Pro |
For the given indicators, we present the F and p values, and also identify the subset of the data with the highest mean value, with the understanding that the difference is statistically significant. A literal interpretation of the first row would be “among people who purchased phones, those who purchased an iPhone lived in block groups that had the highest percentage of population 65+.” Having stated the previous, one assumption we make is that populations 65+ tend to favor iPhones over other types of phones.
Finding Optimal Audiences
The findings from an analysis, such as the one described above, can have a significant impact on a marketing strategy, both at a macro and micro level. If you know where your likely customers reside, based on over-represented populations, you can develop a targeting strategy across both digital and traditional channels to acquire new customers. This is our biggest motivator for performing demographic audience segmentation! 19th century retailer John Wanamaker famously stated, “Half the money I spend on advertising is wasted; the trouble is I don’t know which half." In the 21st century, we can greatly reduce the amount of wasted marketing dollars through a targeted data driven approach to marketing by using demographic audience segmentation. Don’t waste your marketing dollars in the wrong locations on the wrong audiences. At Bounteous, we harness customer demographic insights to help our clients target their optimal audiences.