How Can You Prepare for the End of Adobe's Reports & Analytics?

In early January 2022, Adobe announced that Adobe Analytics' Reports & Analytics is headed towards an "end-of-life" by the end of 2023. What does this mean and how can you be best prepared?
What Is "Reports & Analytics"?
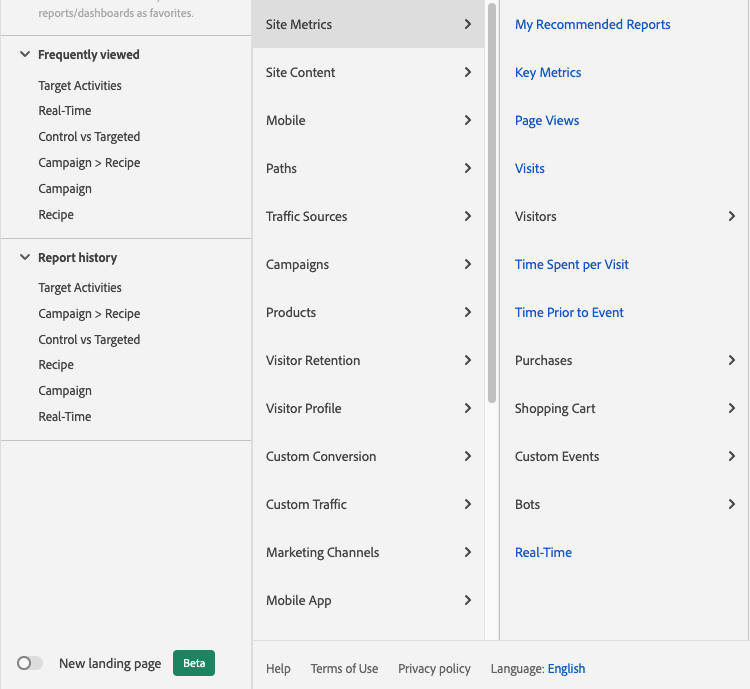
Reports & Analytics is the name of Adobe Analytics’ default reporting ecosystem, where you can navigate and find your data in the system (outside of Analysis Workspace):
With the advent and rise of Analysis Workspace as Adobe Analytics’ primary reporting and utilization area, many of the features of Reports & Analytics have become duplicative, which is why Adobe is moving Reports & Analytics towards end-of-life.
In the words of Adobe from their announcement:
"Over the past six years, Reports & Analytics functionality and capabilities have been moved to Analysis Workspace and a threshold of workflow parity has been reached."
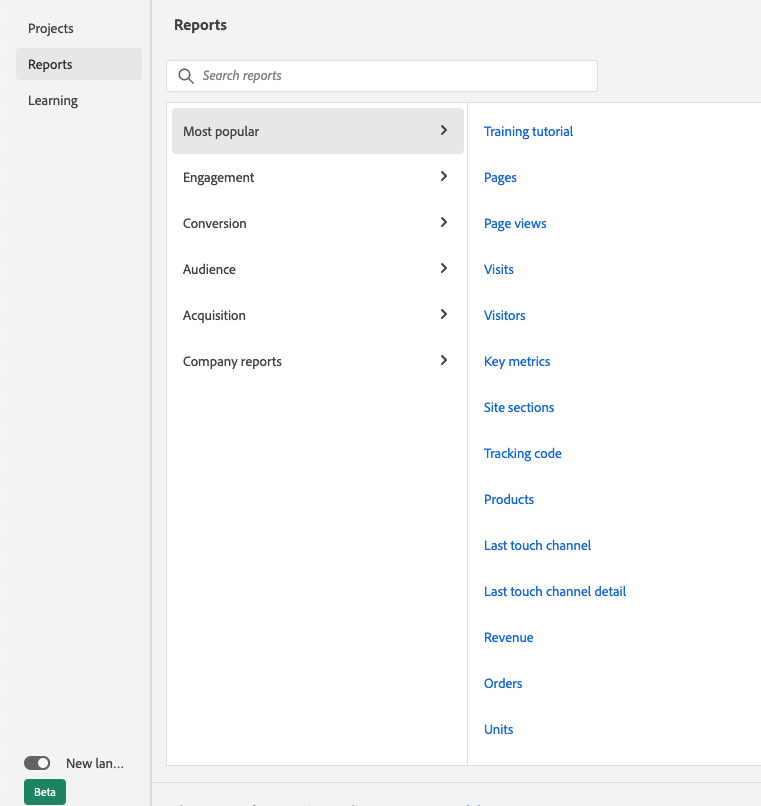
Within Analysis Workspace, you can access a similar reporting interface as with Reports & Analytics by toggling on the "New landing page" item in the bottom left of the screenshot below:
When Is the End of Reports & Analytics in Adobe Analytics?
To understand what’s happening, let’s first understand the terminology that Adobe is using in this situation. In their announcement, they announced four key dates to keep in mind here for Reports & Analytics:
| January 4, 2022: Intention to end-of-life announced | Translation: We released the announcement of what’s happening on this date. |
| April 1, 2022: End-of-service-life | Translation: Adobe notes it will still be usable but "Adobe will no longer test it, fix associated bugs…" - i.e., it’s still around, but maybe don’t rely on it. |
| October 31, 2022: End-of-sale | Translation: Adobe notes it will "no longer sell" Reports & Analytics - i.e., this isn’t going to be a selling point of Adobe Analytics. |
| December 31, 2023: End-of-life | Translation: It will fully go away, and no longer be usable or available - i.e., it’s gone. |
So, in essence, there is close to a full two-year window from announcement to removal of the area from Adobe Analytics.
Why Does This Matter?
This matters because as part of this process, Adobe is basically splitting features into two camps:
- Specific features will be supported with this move by Adobe
- Other features will be deprecated (i.e., no longer supported/no longer exist)
Now Is the Time to Get Ready for Reports & Analytics End-of-life
The main purpose of this post will be to prepare you for the items discussed below.
Without any delay, let’s dig into those two groups of features.
Features That Will Still Be Supported in Analysis Workspace
Adobe notes that these items, "Will have a parity version in Analysis Workspace. Details and timelines for the projects for these features will be added as more information becomes available."
Summary of items and hyperlinks:
- Combo Charts
- Calendar Events
- Menu Customization
- Bot Reports
- Real-Time Reports
- Targets
- Publishing Lists
- Next/Previous Page Reports
Let's take a closer look at these:
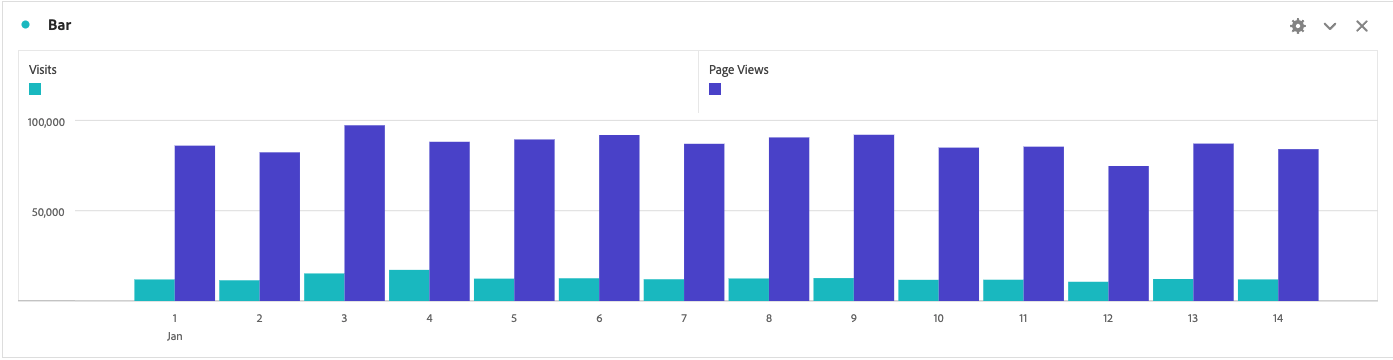
What About Combo Charts?
What is it? This is a visualization with two visualization types (i.e., bar and line).
What value does it provide? It gives you the ability to dynamically visualize data in situations when you need more than one visualization type.
How do you use it? This is not currently available in the Analysis Workspace and is likely to come in the future, for now it only allows the same visualization type, as shown below:
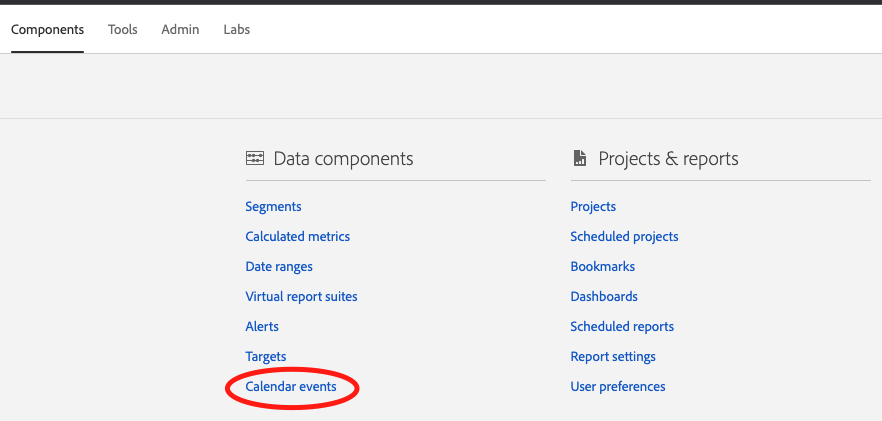
What About Calendar Events?
What is it? This allows you to set up a note to annotate a specific time period for a time-based visualization.
What value does it provide? It allows you to give critical context to spikes/drops for items that are occurring.
How do you use it? Dig into Components > All Components. Then click the area below:
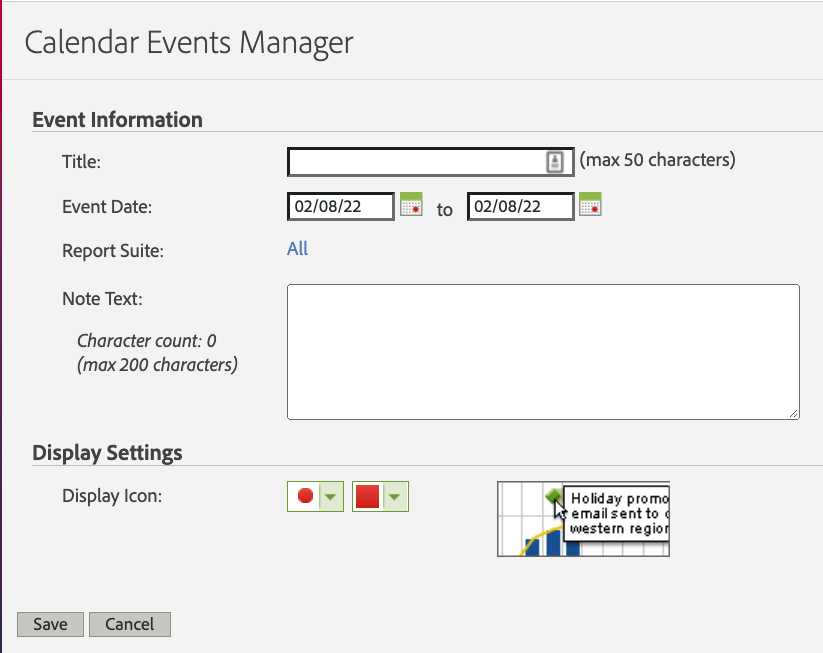
You then have the ability to create the event with your information as noted below:
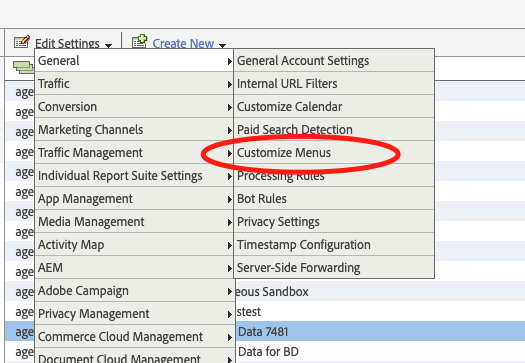
What About Menu Customization?
What is it? This allows you to customize the reporting menu that is available to users.
What value does it provide? You’re enabled to create a menu that fits your organization’s reporting needs.
How do you use it? From the Admin > Report Suites view, this can be found under General > Customize Menus:
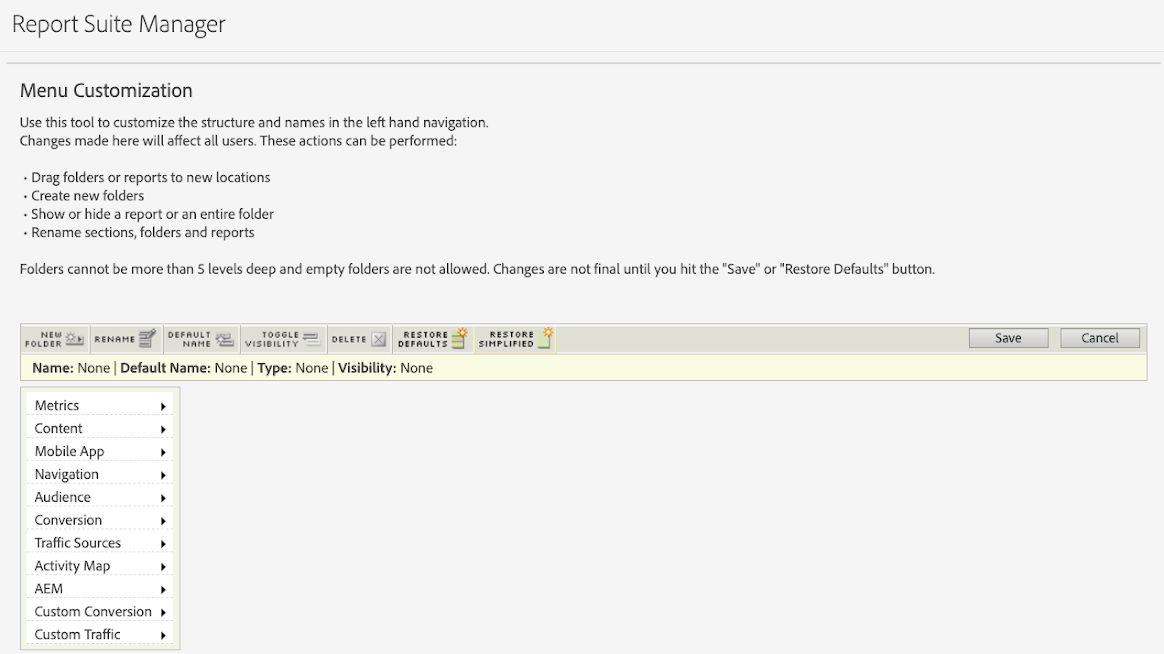
This gives you a screen to pick and choose how reports are used:
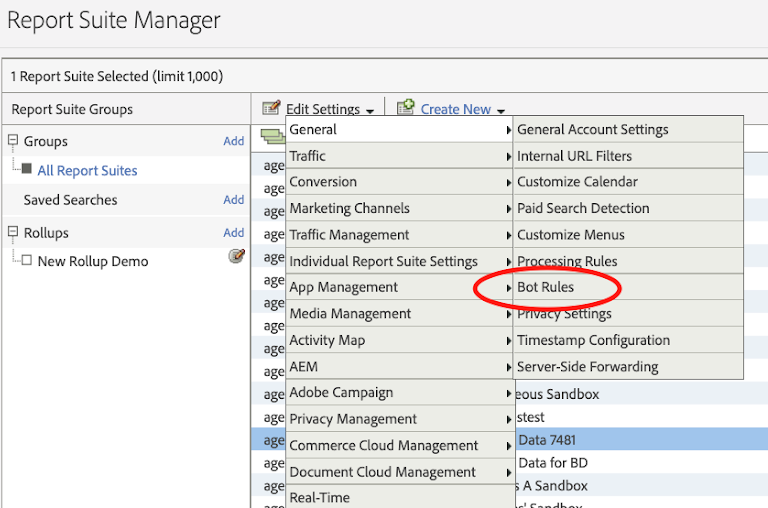
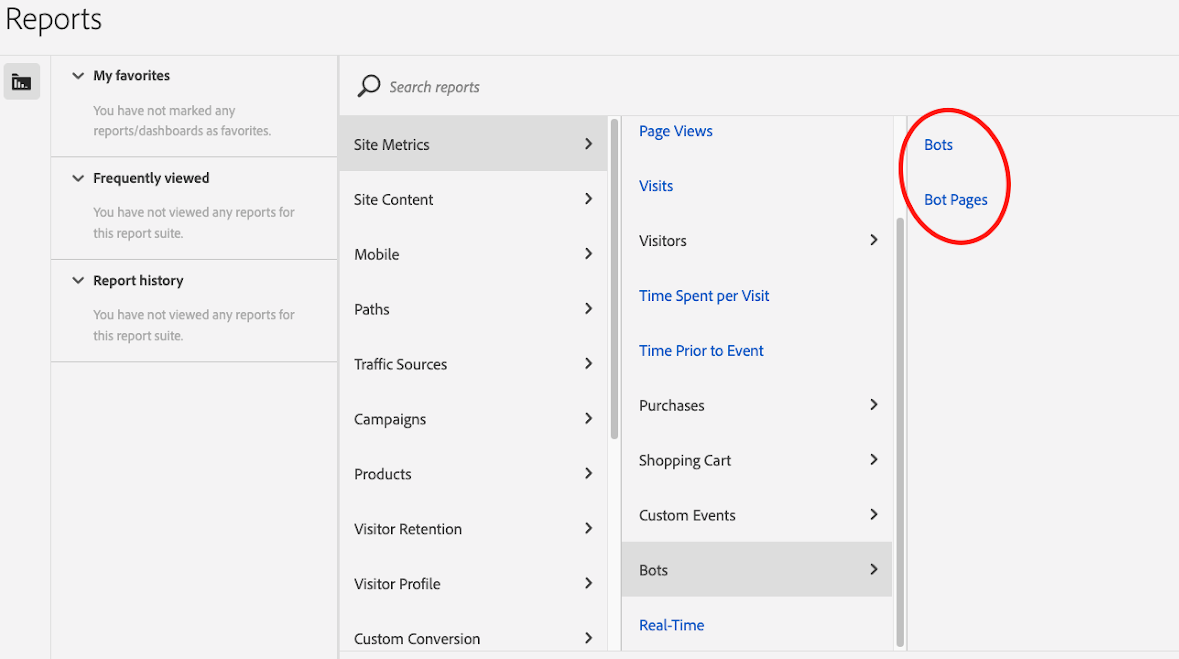
What About Bot Reports?
What is it? You have the ability to remove potential bot traffic from reporting based on user agent or IP information.
What value does it provide? Ensuring your data is as accurate as possible.
How do you use it? From the Admin > Report Suites view, this can be found under General > Bot Rules:
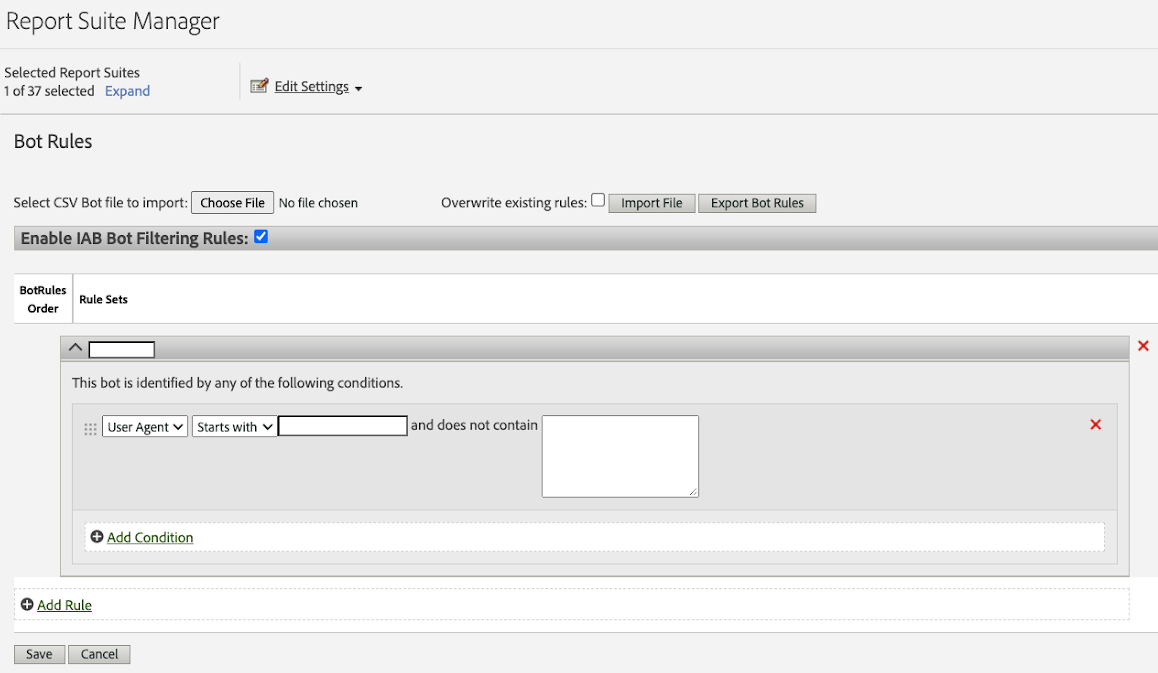
This then informs the bot reporting overall:
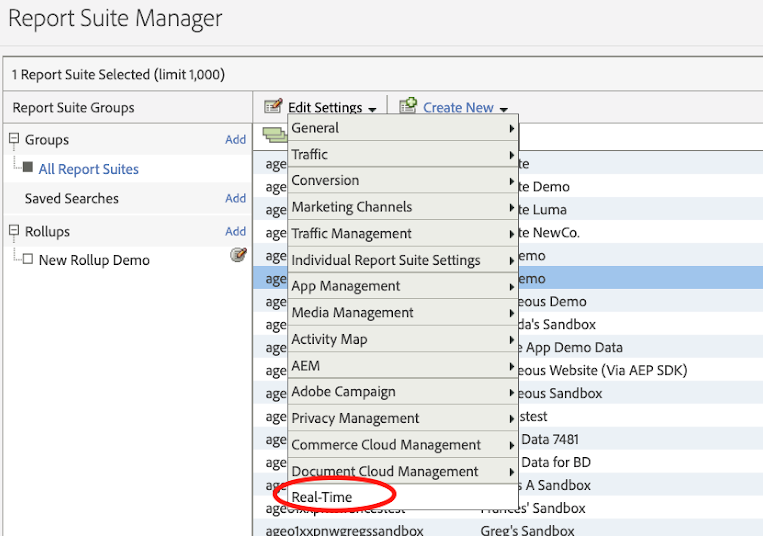
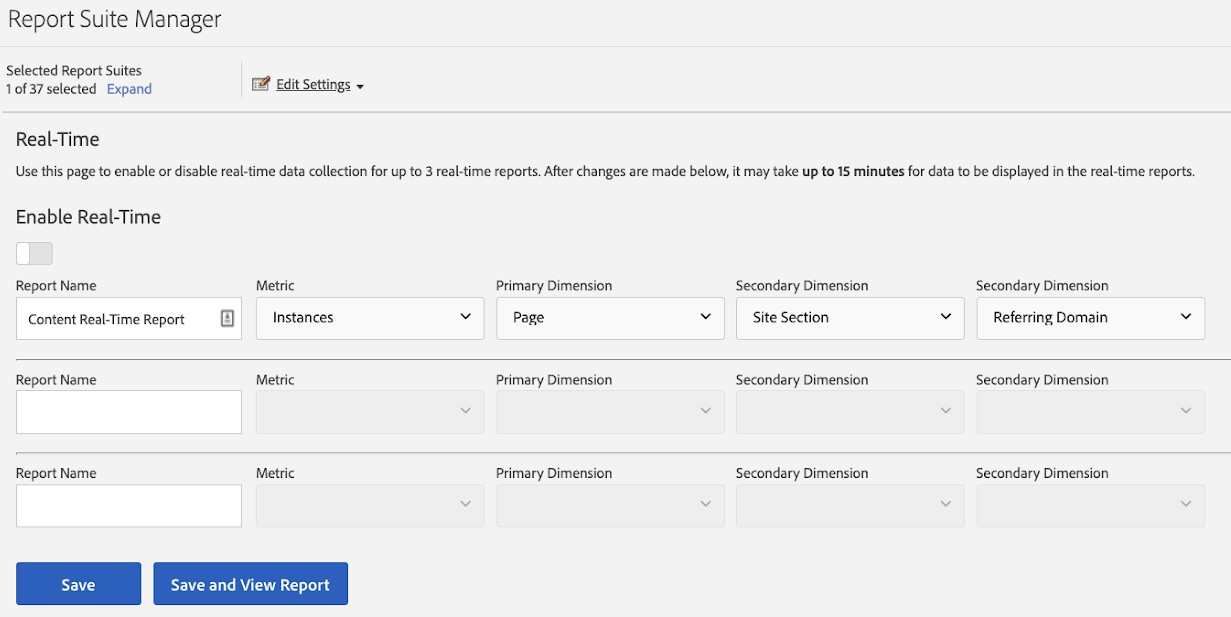
What About Real-Time Reports?
What is it? The ability to understand data on your website in real-time.
What value does it provide? Ensuring that data is tracking accurately, evaluating new pages/new tracking when it launches, etc.
How do you use it? From the Admin > Report Suites view, this can be found under Real-Time Reporting:
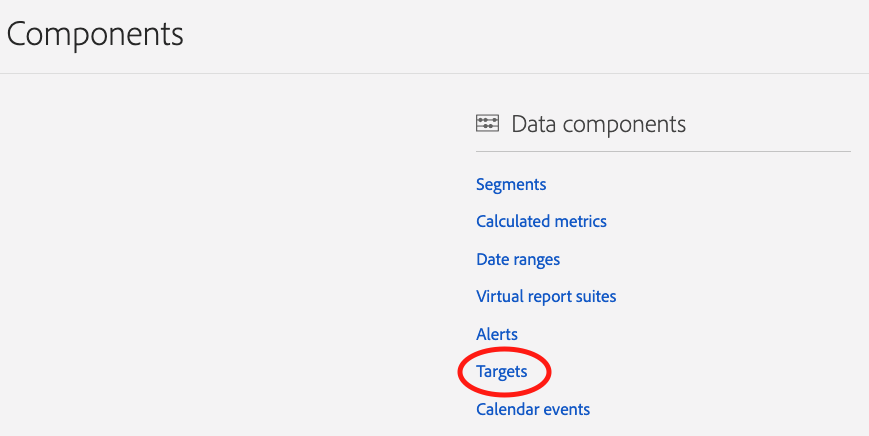
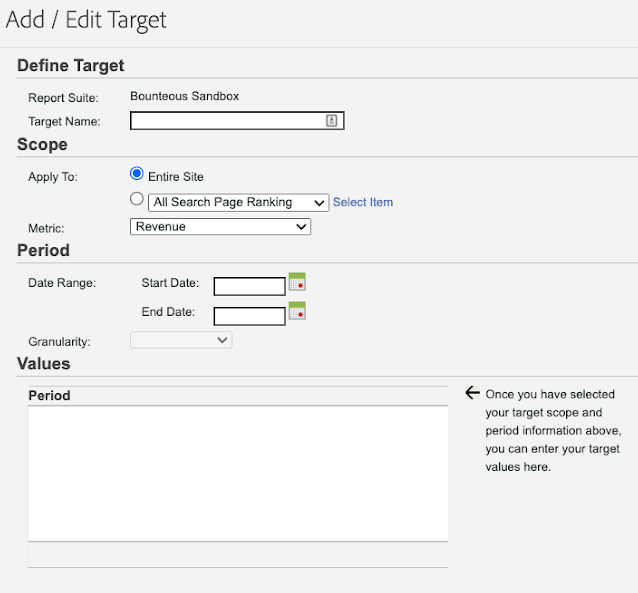
What About Targets?
What is it? The ability to set goals against which you can measure your actual data/website performance.
What value does it provide? Gives you the ability to ensure that you understand how your data is performing against set benchmarks.
How do you use it? Under Components, you can select it as shown below:
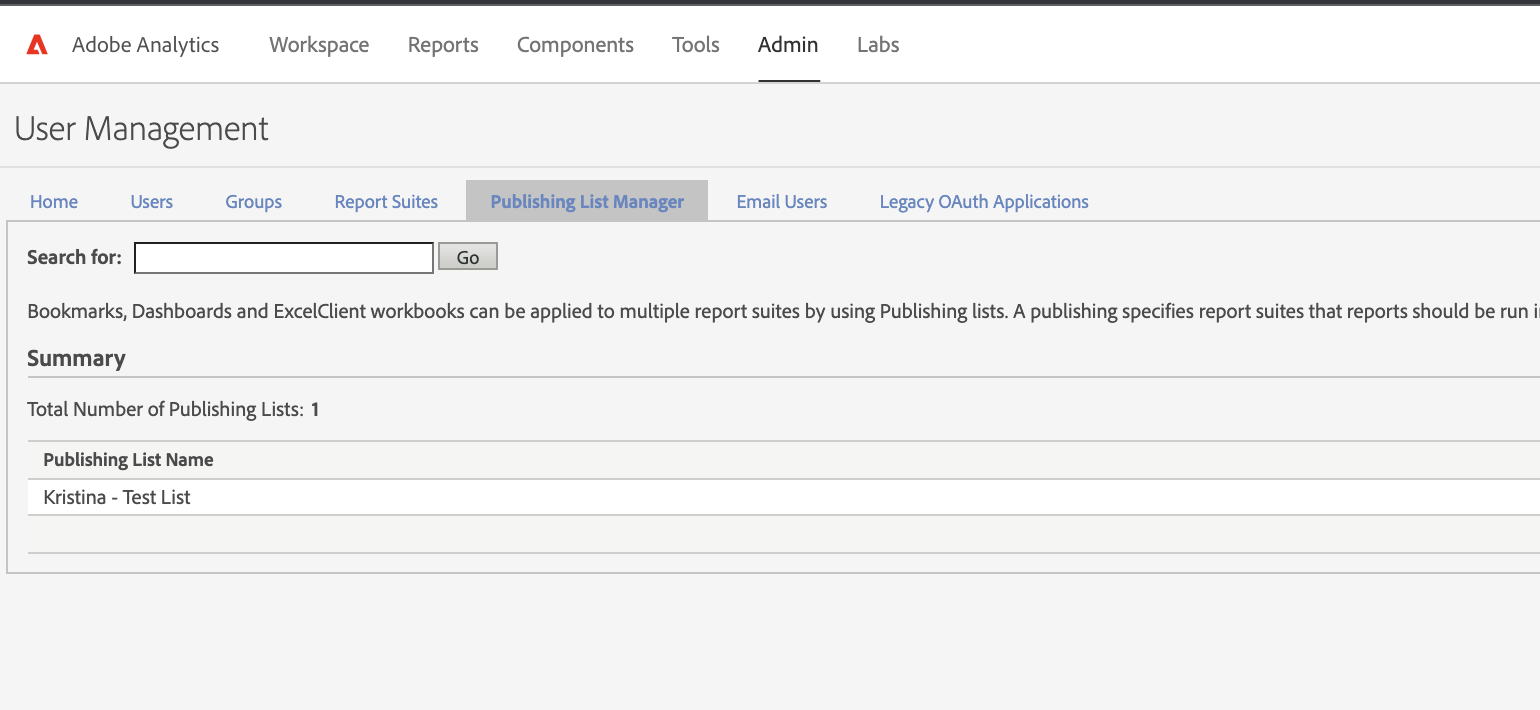
What About Publishing Lists?
What is it? The ability to send specific reports to groups of users instead of adding them individually.
What value does it provide? Allows for the scalable distribution of reports vs. adding each person individually.
How do you use it? This is viewable in the legacy Admin set-up: Admin Tools > User Management > Publishing List Manager. You could also use the User Groups functionality to similarly share out reports as needed.
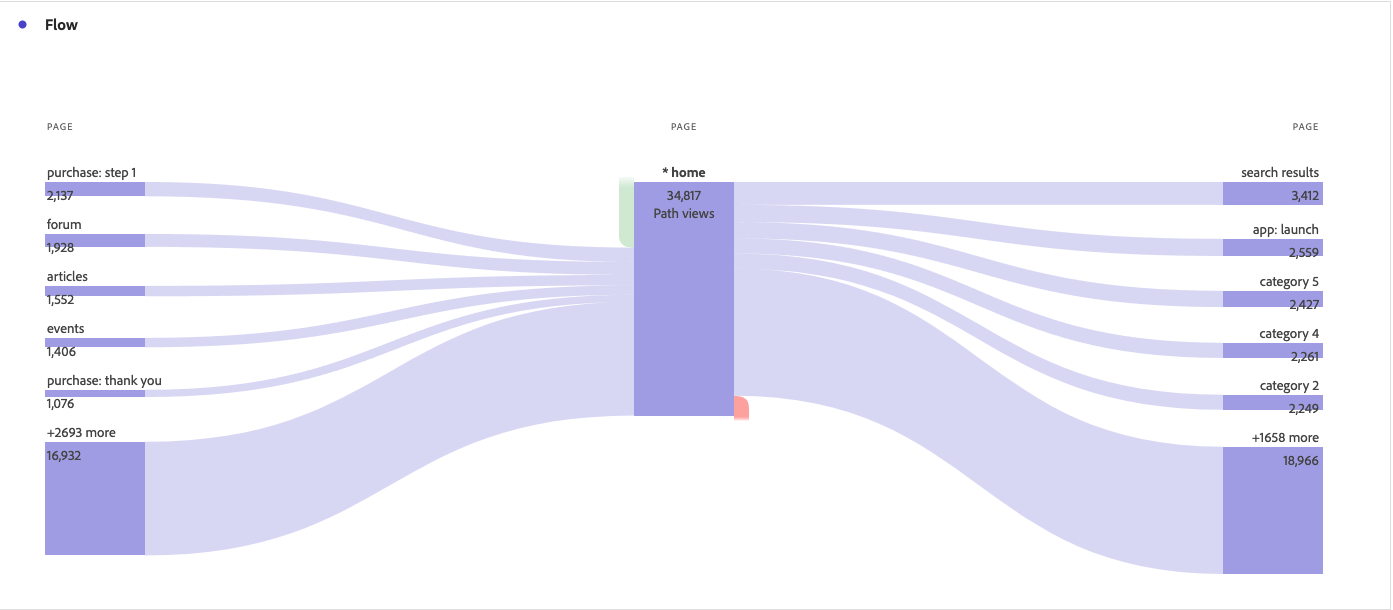
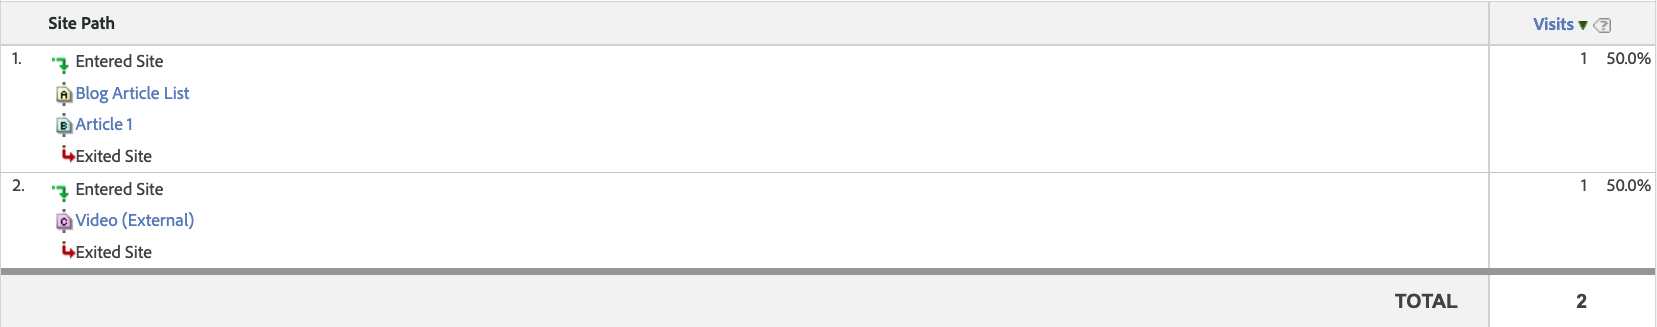
What About Next/Previous Page Reports?
What is it? The ability to evaluate page pathing for users by understanding where they went after viewing a page or prior to viewing a page.
What value does it provide? Understanding user website flow to ensure an ideal customer journey.
How do you use it? You can use the existing Flow reporting in Analysis Workspace to evaluate pages.
All these features users have come to know and love will be usable in Analysis Workspace by end of December 2023 (end-of-life) for Reports & Analytics, so users don't have to worry.
What Features Will Be Deprecated?
Summary of items and hyperlinks:
- Bookmarks
- Dashboards
- Custom Reports
- Publishing Widgets
- Current Data
- Data Extract
- Default Metrics
- Data Filter Button
- Pathfinder
- Full Paths
- DL Reports
- Roll-Up Report Suites
- Marketing Channel Reports
- Smoothing Applied
- Custom Conversion Reports
These are features that will not be carried over to Analysis Workspace with the Reports & Analytics end-of-life. Let’s detail the impact and what alternative features you can use with these going away.
Bookmarks
What is it? Bookmarks give you the ability to save reports that you reference consistently for easy access.
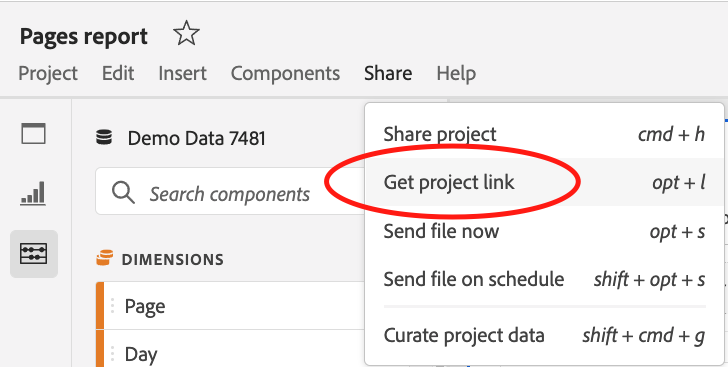
What are the alternatives? You have the ability to easily save and create quick links to Analysis Workspace projects, so this essentially covers this use case (you also have the star option in the top left below to place it into your "My Projects" folder of the Workspace section).
You could also approve projects (i.e., workspaces) via the manage projects panel to create a set workflow for sharing. Another even more creative option for ease of navigation would be the following, creating a "table of contents" style workspace with links to key areas set as the home page for specific users—for ease of navigation.
Dashboards
What is it? Dashboards are an extremely outdated reporting structure in Adobe Analytics that are still technically available.
What are the alternatives? Everything that can be done with Dashboards can be done better with Analysis Workspace—there is no loss here. The only item that you may want to plan for here is considering moving over any critical dashboards to Analysis Workspace prior to the end of 2023. This also provides a good opportunity to audit existing reporting, segments, and calculated metrics. Is everything that you’ve been using here still useful, and even necessary to carry over?
Custom Reports
What is it? This largely follows the same trends as Dashboards above—an outdated reporting structure that’s still technically available.
What are the alternatives? Analysis Workspace is a better system to use than Custom Reports, so nothing lost. As with Dashboards, consider migrating any critical items to Analysis Workspace before the end of 2023.
Publishing Widgets
What is it? This is different vs. publishing lists to be clear but serves a similar purpose in a different way. Publishing widgets allow you to embed a report on a page for users to be able to access. So, it distributes the report similar to publishing lists in the way that it makes it available to multiple people, just in a different way.
What are the alternatives? The clearest alternative for Analysis Workspace is simply linking/giving access to the report with the relevant links to log in to Adobe. This doesn’t get you 100 percent of the functionality of what Publishing Widgets do, but it gets close.
Current Data
What is it? This has to do with data processing. By default, when you view a report, it includes Current Data, i.e., the most recently processed data, even within minutes of processing. This can be seen below:
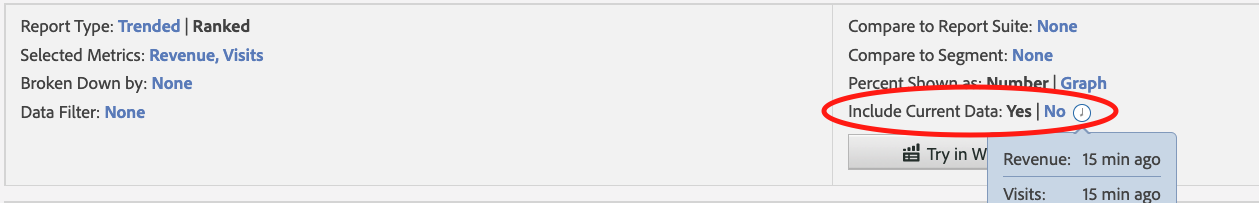
What are the alternatives? Analysis Workspace by default utilizes fully processed data—Adobe notes this can take up to two hours. The way I look at it is, that you’re basically trading a small amount of time for greater data accuracy, which is a trade I’m willing to make every time.
Data Extract
What is it? This allows you to modify an existing report based on the parameters that you’re looking for:

What are the alternatives? Analysis Workspace is built to be inherently flexible with your dimensions, metrics, date ranges, segments, etc.,—so this is basically no longer necessary.
Default Metrics
What is it? All conversion reports by default have specific metrics displayed. This can be altered in report suite settings.
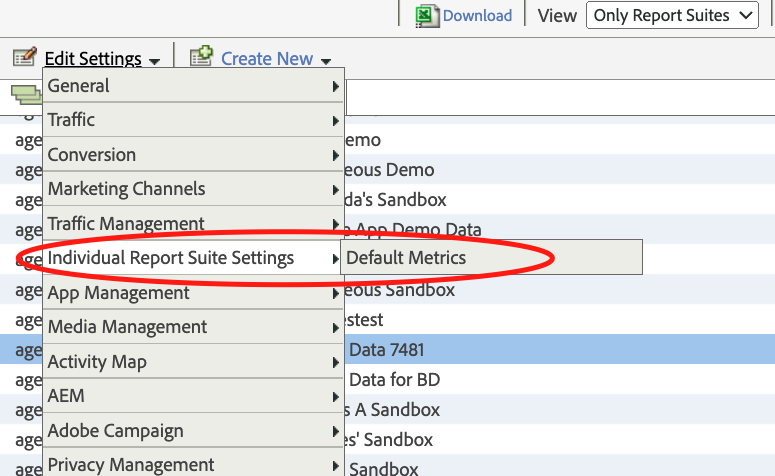
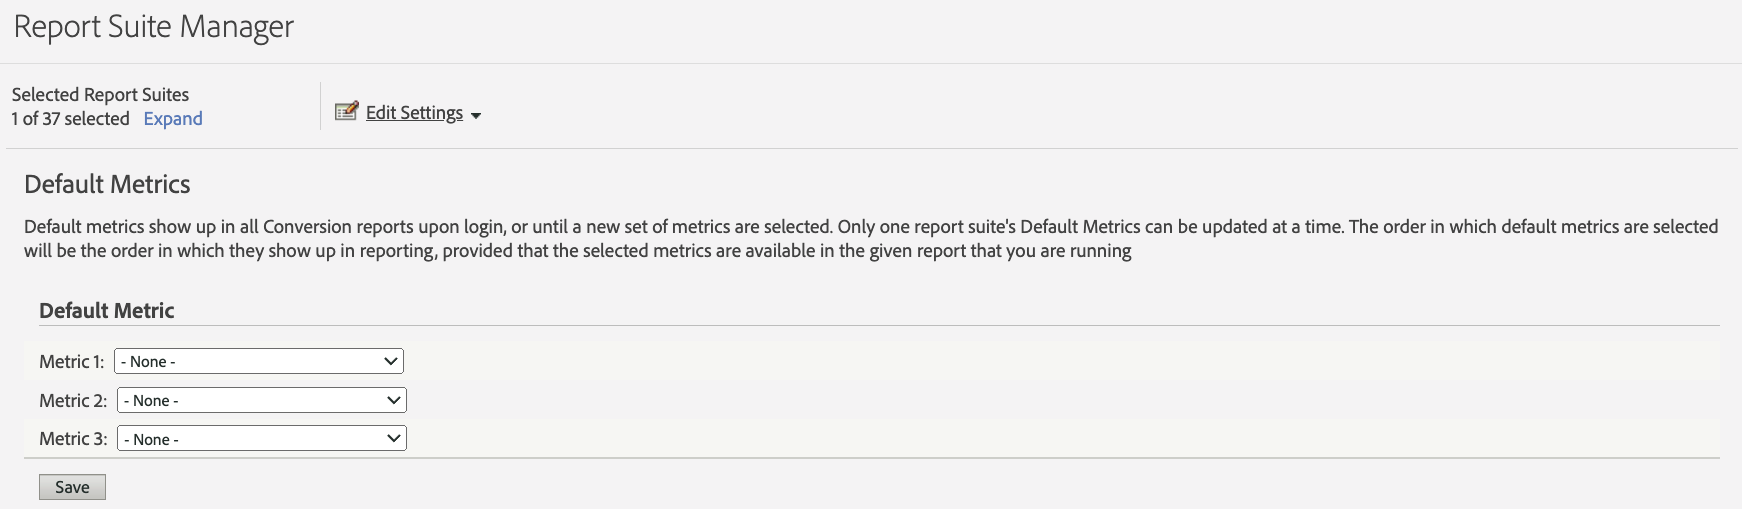
What are the alternatives? In Analysis Workspace, you can easily choose the metrics most relevant to your report type—in essence defeating the purpose of having default metrics to select. You also have the ability to "curate" project data on a workspace-by-workspace basis to make data utilization easier for users.
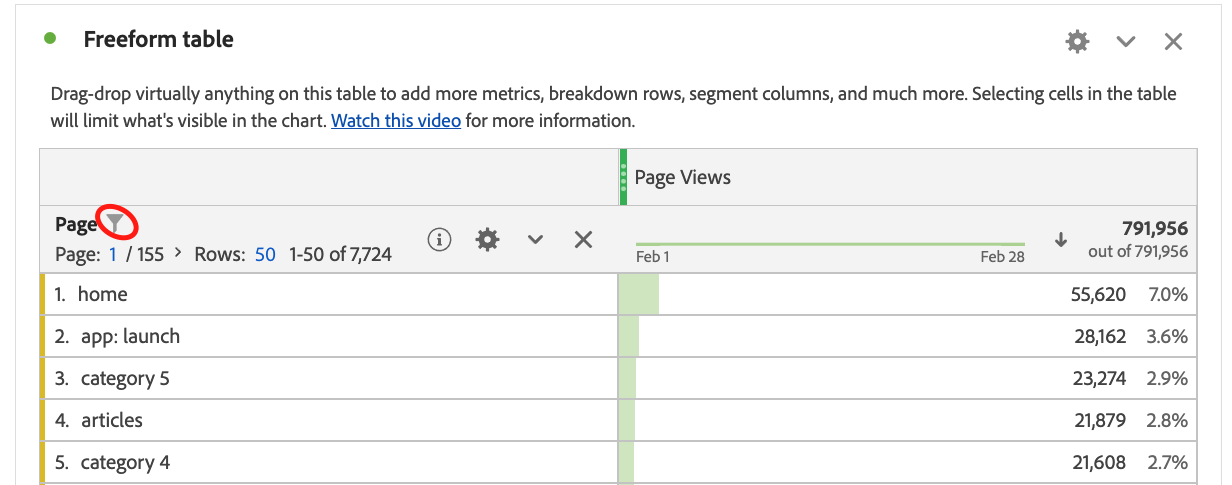
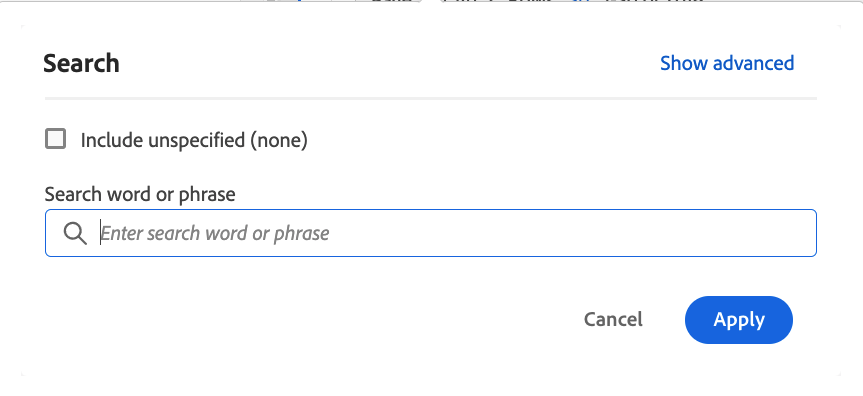
Data Filter Button
What is it? This is just filtering a data report to see more specific data:

What are the alternatives? All data is filterable by default in Analysis Workspace, so this is technically available, just without the button format:
Pathfinder
What is it? Pathfinder is a historical pathing tool by Adobe Analytics that allows you to break down specific types of paths up to four steps.
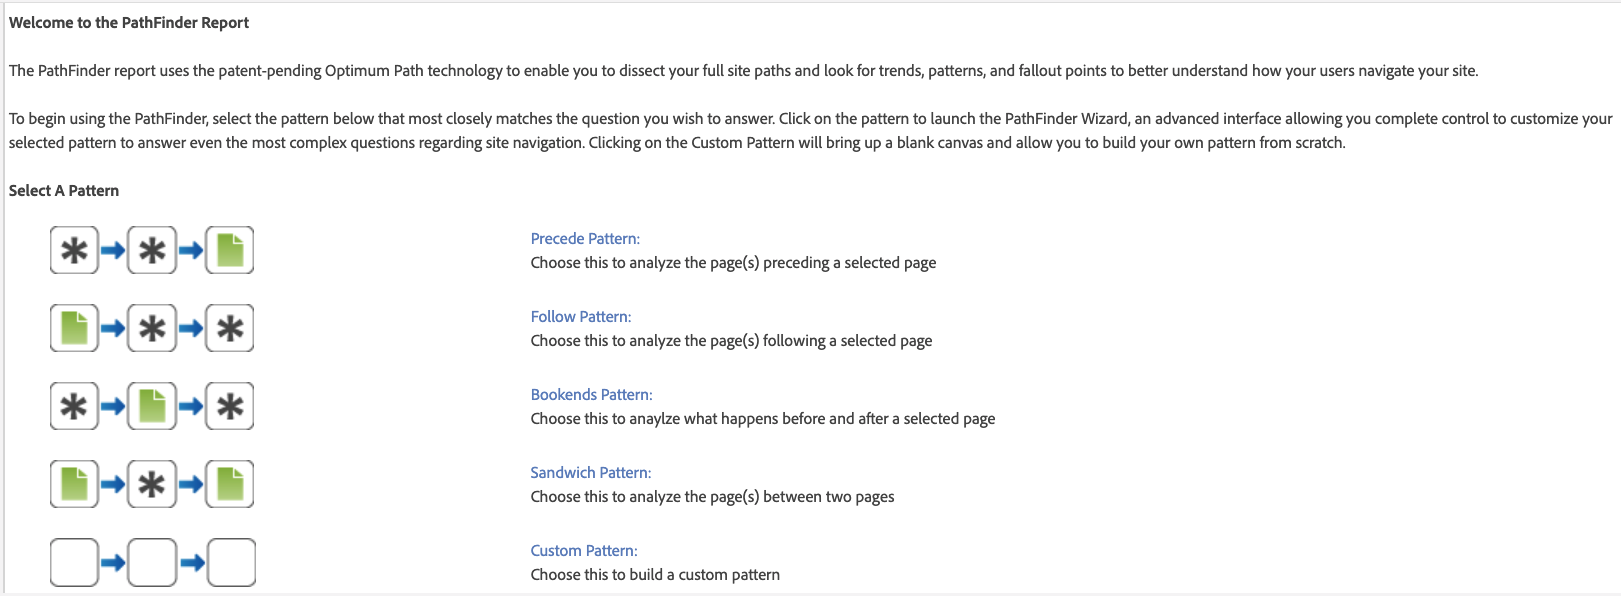
What are the alternatives? To leverage similar functionality in Adobe without this feature, you can use flow reporting (as noted above), or create sequential segments with include options.
Full Paths
What is it? This is another alternative to Pathfinder that allows you to evaluate less specific paths up to eight steps.
What are the alternatives? My same notes as with Pathfinder above hold for Full Paths (with the ability to leverage flow/next/previous reporting and sequential segmentation).
DL Reports
What is it? I’m not following what "DL" stands for in Adobe’s terminology here, unless this means the ability to download reports.
What are the alternatives? If this is downloading reports, you’ll be able to do this in Analysis Workspace, but I don’t want to assume what this is personally.
Roll-Up Report Suites
What is it? This approach for a report suite is not being recommended by Adobe any further, with alternatives given, and no Analysis Workspace support planned for this option.
What are the alternatives? See our own Paulina Berger’s blog post series for more information on alternatives to roll-up report suites:
Marketing Channel Reports
What is it? There are set reports to cover marketing channel information, and these reports help to analyze this data:
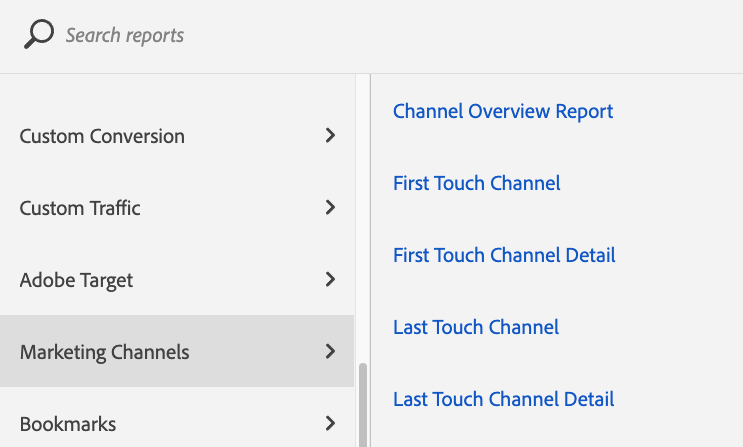
What are the alternatives? Although the reports themselves won't exist in Analysis Workspace, the dimensions for marketing channels in Analysis Workspace will still be usable, so the reports aren’t honestly necessary with the flexibility of Analysis Workspace. One could easily set up a premade marketing channel and campaign report via Analysis Workspace for users to be able to access as an intermediary step.
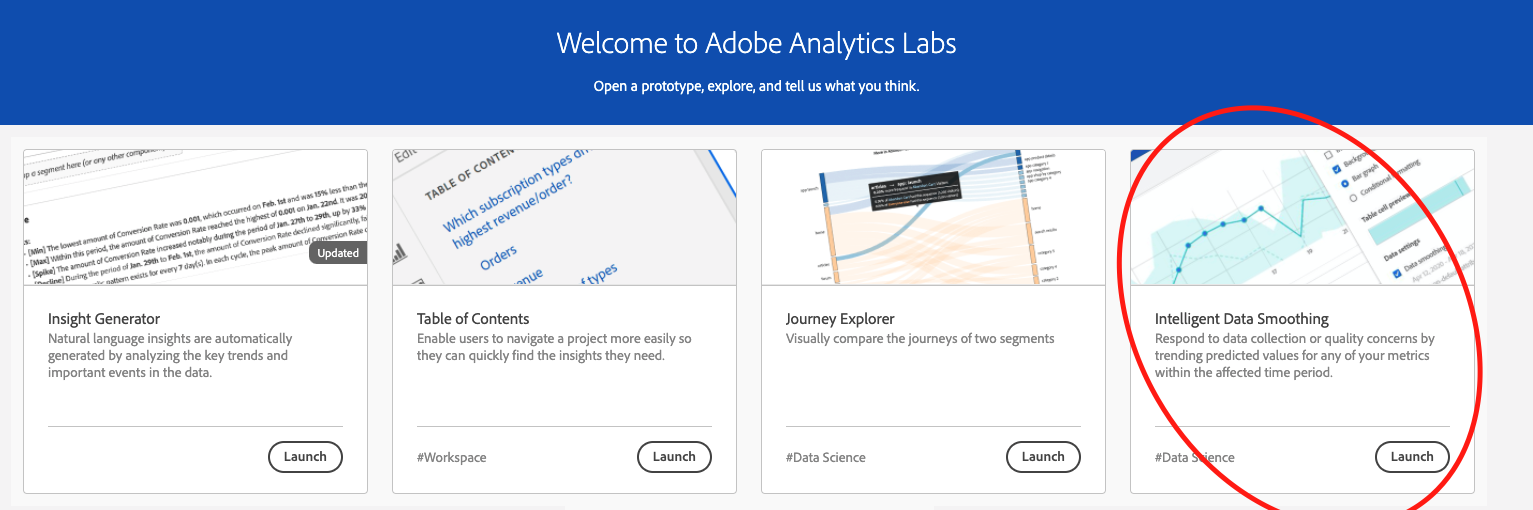
Smoothing Applied
What is it? I’m under the impression that this is "normalizing" data in Adobe Analytics, basically removing any bots or superfluous information.
What are the alternatives? Adobe Analytics appears to be piloting out Intelligent Data Smoothing as a new feature, so this in essence would replace Smoothing Applied if this is launched.
Custom Conversion Reports
What is it? Custom conversions are eVars, so this references the reports specific to eVars overall.
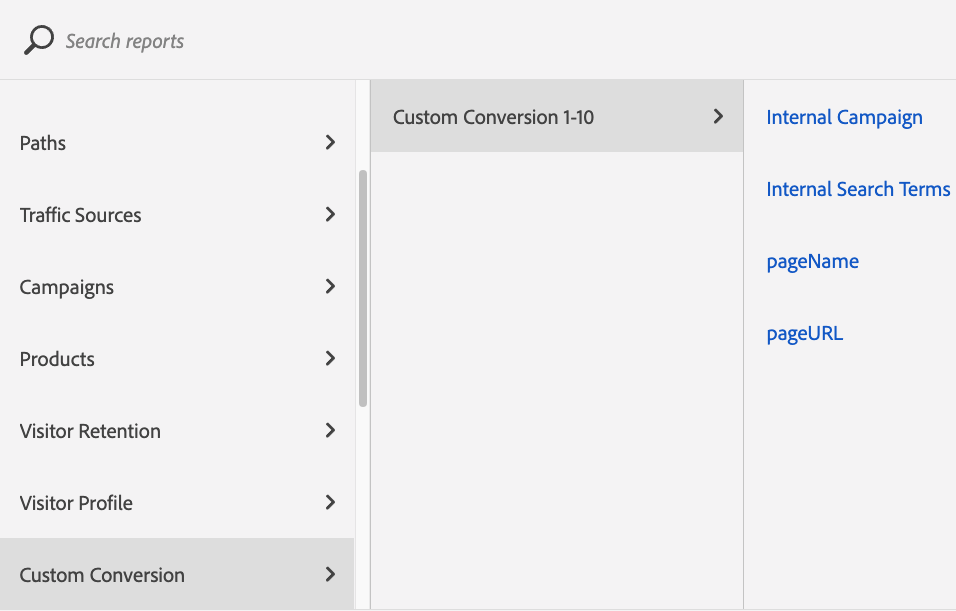
What are the alternatives? You can drag and drop in the relevant eVars into Analysis Workspace— no loss here.
As you can probably see from the findings above, even though these items are being formally deprecated, most of them have reasonable alternatives available in Analysis Workspace.
What Are the Next Steps I Should Take?
To summarize what you should focus on based on this announcement:
| Ensure that any and all future reports are created within the Analysis Workspace, with this being the primary source of data in Adobe Analytics moving forward. |
| Ensure you document and transfer any Custom Reports and/or Dashboards to Analysis Workspace in Adobe Analytics as needed. |
| For any of the deprecated features above that you’ve been using heavily in the past, find ways to leverage existing features in the same manner. This could include: 1) Pathfinder and/or Full Paths to Next/Previous Page / Flow reporting. 2) Any reports that are going away that you can recreate in Workspace (Marketing Channel Reports, Custom Conversion Reports, etc.). |
| As Adobe mentions recreate any scheduled reports from Reports & Analytics in Analysis Workspace. |
As noted previously as well, this is also an ideal time to audit existing reporting, segmentation, etc., and help to train users on Analysis Workspace. Those efforts will pay major dividends moving forward.
The good news on all of these items is that you have time—nothing formal is changing before the end of 2023. With this post, you can be well prepared and onto bigger and better things for Adobe Analytics with Analysis Workspace at the forefront moving forward.